
You want to learn a valuable technology skill. You have heard about data science, data analysis, Python, Power BI, and machine learning. Perhaps someone has told you that data science is the future, while another person insists you should start with data analysis.

Now you are wondering: Which one should I actually learn first?
It is a reasonable question, especially if you are a Nigerian student, recent graduate, NYSC member, working professional, or someone considering a career change.
You may have limited time, a modest training budget, or no previous programming experience. The last thing you want is to spend months learning tools without understanding how to use them.
Here is the short answer: Data analysis is often a more accessible starting point for beginners, while data science offers a broader technical pathway involving programming, statistics, and predictive modelling.
However, that does not mean everybody must learn data analysis before data science.
The better choice depends on your interests, existing skills, available resources, and the kinds of problems you want to solve.
This guide explains the differences, the skills involved, what a good data science course should teach, and how to make a practical learning decision in Nigeria.
First, What Is Data Analysis?
Data analysis involves collecting, cleaning, organising, examining, and interpreting information to answer questions or support decisions.
Think about a small business in Ilorin that sells food and drinks.
The owner records daily sales but cannot confidently answer a few important questions:
- Which product generates the most revenue?
- Which days are usually busiest?
- Has revenue increased or decreased?
- Which products should receive more attention?
- Are sales trends different across locations?
A data analyst can examine the records using tools such as Microsoft Excel, Google Sheets, SQL, or Power BI.
The analyst cleans the records, performs calculations, creates charts, and explains the findings.
The important part is not simply producing colourful dashboards. It is helping someone understand what the information means.
For example, if a particular food item generates the most revenue, the analyst might recommend examining its demand, cost, and profitability before deciding whether to increase production.
Data analysis turns records into information people can use.
What does a data analyst do?
Depending on the organisation, a data analyst may:
- Collect and organise records.
- Identify missing, duplicated, or incorrect data.
- Calculate business or operational performance indicators.
- Compare results across different periods.
- Use SQL to retrieve information from databases.
- Build charts, reports, and dashboards.
- Explain findings to managers, clients, or other stakeholders.
Data analysis is relevant in healthcare, banking, agriculture, education, retail, telecommunications, public administration, and many other sectors.
You do not have to work for a technology company to use data analysis.
A school administrator, hospital officer, entrepreneur, researcher, or small-business owner may also benefit from understanding how to work with information.
What Is Data Science?
Data science is a broader discipline that combines programming, statistics, analytical methods, and computational techniques to investigate data and solve problems.
It may involve developing models that estimate future outcomes, identify complex patterns, or support automated decisions.
Return to our small food business.
The owner now wants to estimate demand during the next festive period.
A data scientist might examine historical transactions, prices, seasonal patterns, and other relevant information to build a forecasting model.
The model could help estimate future demand, provided the available data is sufficient and the method is appropriate.
Data science is also used in areas such as:
- Predicting customer demand.
- Detecting potentially fraudulent transactions.
- Analysing disease patterns.
- Developing recommendation systems.
- Classifying images or documents.
- Studying agricultural yields.
- Building and evaluating machine learning models.
Not every data science project uses artificial intelligence. Some rely mainly on statistics, experiments, data preparation, and conventional analytical methods.
Data science combines data, computation, and statistical reasoning to investigate problems, including questions about what may happen next.
Data Science vs Data Analysis: What Is the Difference?
Both disciplines work with data, and their responsibilities frequently overlap.
The following comparison shows common differences.
| Area | Data Analysis | Data Science |
|---|---|---|
| Main focus | Understanding and interpreting data | Analysing data and developing statistical or predictive solutions |
| Typical questions | What happened? Why might it have happened? | What might happen next? Can we model the outcome? |
| Common tools | Excel, SQL, Power BI, Tableau, Python | Python, SQL, pandas, statistical libraries, machine learning tools |
| Programming | Helpful and sometimes required | Usually an important part of the work |
| Mathematics | Descriptive statistics and other relevant methods | Often deeper probability, statistical inference, and mathematical modelling |
| Common outputs | Dashboards, reports, charts, recommendations | Analytical reports, forecasts, models, and data products |
| Beginner experience | Often easier to approach through spreadsheets | Usually requires a broader technical foundation |
These distinctions are not absolute.
Some data analysts develop predictive models. Some data scientists spend much of their time cleaning data, preparing reports, and explaining findings.
The difference depends on the role, organisation, dataset, and problem being solved.
Which Is Better for Beginners in Nigeria?
For many beginners, starting with data analysis makes sense.
You can learn how information is structured, how to identify errors, and how to answer practical questions before moving into advanced programming.
But learning data science from the beginning is also possible, particularly through a programme designed to introduce the foundations gradually.
Consider these three situations.
1. You have never written code
Imagine you are a Mass Communication student at the University of Ilorin. You are interested in technology but have never used Python or SQL.
You could begin by analysing survey responses or social media performance using Excel.
That experience introduces important ideas: organising information, comparing figures, building charts, and interpreting results.
From there, you can progress to SQL, Power BI, or Python.
Suggested starting point: Data analysis foundations.
2. You enjoy mathematics and programming
Perhaps you are studying Computer Science, Mathematics, Statistics, or Engineering.
You already enjoy solving logical problems and want to understand how machine learning systems work.
A beginner-friendly data science course may suit you, provided it teaches Python, statistics, data preparation, and model evaluation properly.
Suggested starting point: Data science, with a structured foundation.
3. You work with business or organisational records
Suppose you manage a small business, work in an administrative department, or handle operational reports.
You want to understand revenue, expenses, customer behaviour, or performance trends.
You may gain immediate practical value from learning spreadsheets, basic statistics, SQL, and dashboard development.
Suggested starting point: Data analytics, with the option to study data science later.
The best choice is not necessarily the more advanced-sounding course.
It is the pathway that matches the problems you want to solve and the amount of technical depth you are ready to develop.
What Skills Should You Learn First?
Rather than trying to master every available tool, build your skills progressively.
Stage 1: Learn how data works
Understand:
- Rows, columns, records, and datasets.
- Different types of data.
- Missing values and duplicates.
- Basic calculations.
- Percentages, averages, and proportions.
- How to ask useful questions about information.
Start with Excel or Google Sheets.
These tools provide a practical introduction to data organisation and analysis.
Stage 2: Learn how to analyse and present findings
Progress to:
- Sorting and filtering.
- Formulas and lookup functions.
- Pivot tables.
- Data cleaning.
- Basic descriptive statistics.
- Charts and data visualisation.
- Writing short analytical reports.
At this stage, practise explaining what your findings mean, not merely showing the numbers.
Stage 3: Understand databases and SQL
SQL allows you to retrieve, filter, combine, and summarise information stored in relational databases.
Important introductory concepts include:
- SELECT
- WHERE
- ORDER BY
- GROUP BY
- JOIN
You do not need to memorise every command immediately.
Practise retrieving information and explaining why each query answers a particular question.
Stage 4: Learn Python
Python becomes particularly useful when working with larger datasets, repetitive analytical tasks, statistical methods, and machine learning.
Useful beginner topics include:
- Variables and data types.
- Lists and dictionaries.
- Conditions and loops.
- Functions.
- Working with files.
- NumPy and pandas.
- Basic data visualisation.
If programming is new to you, allow time for experimentation and mistakes.
Understanding why code works is more valuable than copying a solution you cannot explain.
Stage 5: Progress into statistics and machine learning
If you choose to develop deeper data science skills, explore:
- Probability.
- Statistical inference.
- Hypothesis testing.
- Exploratory data analysis.
- Regression.
- Classification.
- Clustering.
- Model evaluation.
- Overfitting and data leakage.
- Responsible use of data.
Learning to assess the limitations of a model is just as important as learning to build one.
You do not need to complete these stages in a fixed number of weeks. Progress depends on your starting knowledge, practice time, instruction, and the complexity of your projects.
Try This Beginner Data Analysis Project
You do not need to wait until you finish a course before practising.
Consider a fictional food business in Ilorin that sells rice bowls, meat pies, and zobo.
The following table contains eight sample transactions.
All figures are fictional and provided for learning purposes.
| Date | Product | Quantity | Unit Price (₦) | Revenue (₦) |
|---|---|---|---|---|
| Oct 5 | Rice Bowl | 8 | 2,500 | 20,000 |
| Oct 5 | Zobo | 12 | 700 | 8,400 |
| Oct 6 | Rice Bowl | 6 | 2,500 | 15,000 |
| Oct 6 | Meat Pie | 10 | 1,200 | 12,000 |
| Oct 7 | Zobo | 15 | 700 | 10,500 |
| Oct 7 | Meat Pie | 7 | 1,200 | 8,400 |
| Oct 8 | Rice Bowl | 9 | 2,500 | 22,500 |
| Oct 8 | Zobo | 10 | 700 | 7,000 |
Your assignment
Copy this table into Excel or Google Sheets.
Then complete the following tasks.
Task 1: Calculate revenue
For each transaction:
Revenue = Quantity × Unit Price
If quantity is in column C and unit price is in column D, enter this formula in cell E2:
=C2*D2
Copy the formula down the remaining rows.
Task 2: Find total revenue
Use:
=SUM(E2:E9)
Your total should be ₦103,800.
Task 3: Compare products
Use a pivot table or formulas to calculate total revenue by product.
Your results should be:
| Product | Total Revenue |
|---|---|
| Rice Bowl | ₦57,500 |
| Zobo | ₦25,900 |
| Meat Pie | ₦20,400 |
Rice bowls generated the highest revenue in this fictional sample.
But does that mean the business should focus entirely on rice bowls?
Not necessarily.
Revenue is not profit. The owner would need to consider ingredient costs, preparation time, wastage, and other expenses before making that decision.
Task 4: Create a chart
Build a bar chart comparing the three products.
Give the chart a descriptive title and label the values clearly.
Task 5: Explain the result
Write three short sentences:
- What did you discover?
- What could explain the result?
- What additional information would help the business decide what to do next?
If you can complete this exercise and explain your findings, you have started practising the analytical thinking used in data-related work.
How would data science extend this project?
A data science project could explore forecasting future demand or identifying factors associated with higher sales.
However, eight transactions are far too few to support a dependable forecasting model.
You would need more observations, appropriate variables, and a method for evaluating whether the model performs well on data it has not previously seen.
That distinction matters.
Data science is not simply adding machine learning to a spreadsheet. It involves understanding whether a particular method is suitable and whether its results are reliable.
How to Choose a Good Data Science Course in Nigeria
Searching for a data science course can bring up many options: free tutorials, recorded classes, university programmes, bootcamps, and instructor-led training.
A course should be evaluated by what it helps you understand and produce, not only by the number of tools listed in its advertisement.
Before enrolling, consider the following questions.
1. Does the course welcome your actual skill level?
Some programmes assume knowledge of Python and statistics.
Others begin with basic programming and gradually introduce more advanced concepts.
If you are a beginner, examine the prerequisites carefully.
2. Will you work on practical projects?
A useful curriculum should give you opportunities to:
- Clean datasets.
- Conduct analysis.
- Visualise findings.
- Explain your methods.
- Document your work.
- Present a completed project.
For a data science course, the learning outcomes should also include relevant statistical methods and model-building skills.
3. Is there meaningful feedback?
Ask whether someone will review your assignments, correct misunderstandings, and explain how to improve your work.
Recorded lessons can be valuable, but some learners benefit from direct instruction and feedback.
4. Are the course duration and costs clear?
Look beyond the tuition amount.
Consider:
- Whether you need a personal laptop.
- Internet and electricity costs.
- Transport for physical training.
- Software requirements.
- Assessment or examination fees.
- The weekly time commitment.
A shorter course is not automatically better, and a more expensive course is not automatically more comprehensive.
5. What evidence of learning will you produce?
A certificate can record that you completed a programme, but it does not independently prove competence.
Ask whether you will finish with a practical project that you can demonstrate and explain.
An organised portfolio might include a project objective, dataset information, code or calculations, visualisations, findings, and limitations.
6. Does the course make realistic promises?
Be cautious about any programme promising guaranteed employment, high income, or expert-level skills after a few lessons.
Training can help you develop skills and prepare for opportunities, but professional outcomes also depend on your competence, portfolio, experience, communication, and the requirements of employers or clients.
Is Online or Physical Training Better?
Neither format is automatically superior.
Online learning can be helpful if you need a flexible schedule, have reliable internet access, and can manage independent study.
Physical training may be more suitable if you learn better through classroom interaction, guided practical sessions, and immediate feedback.
Blended learning combines elements of both.
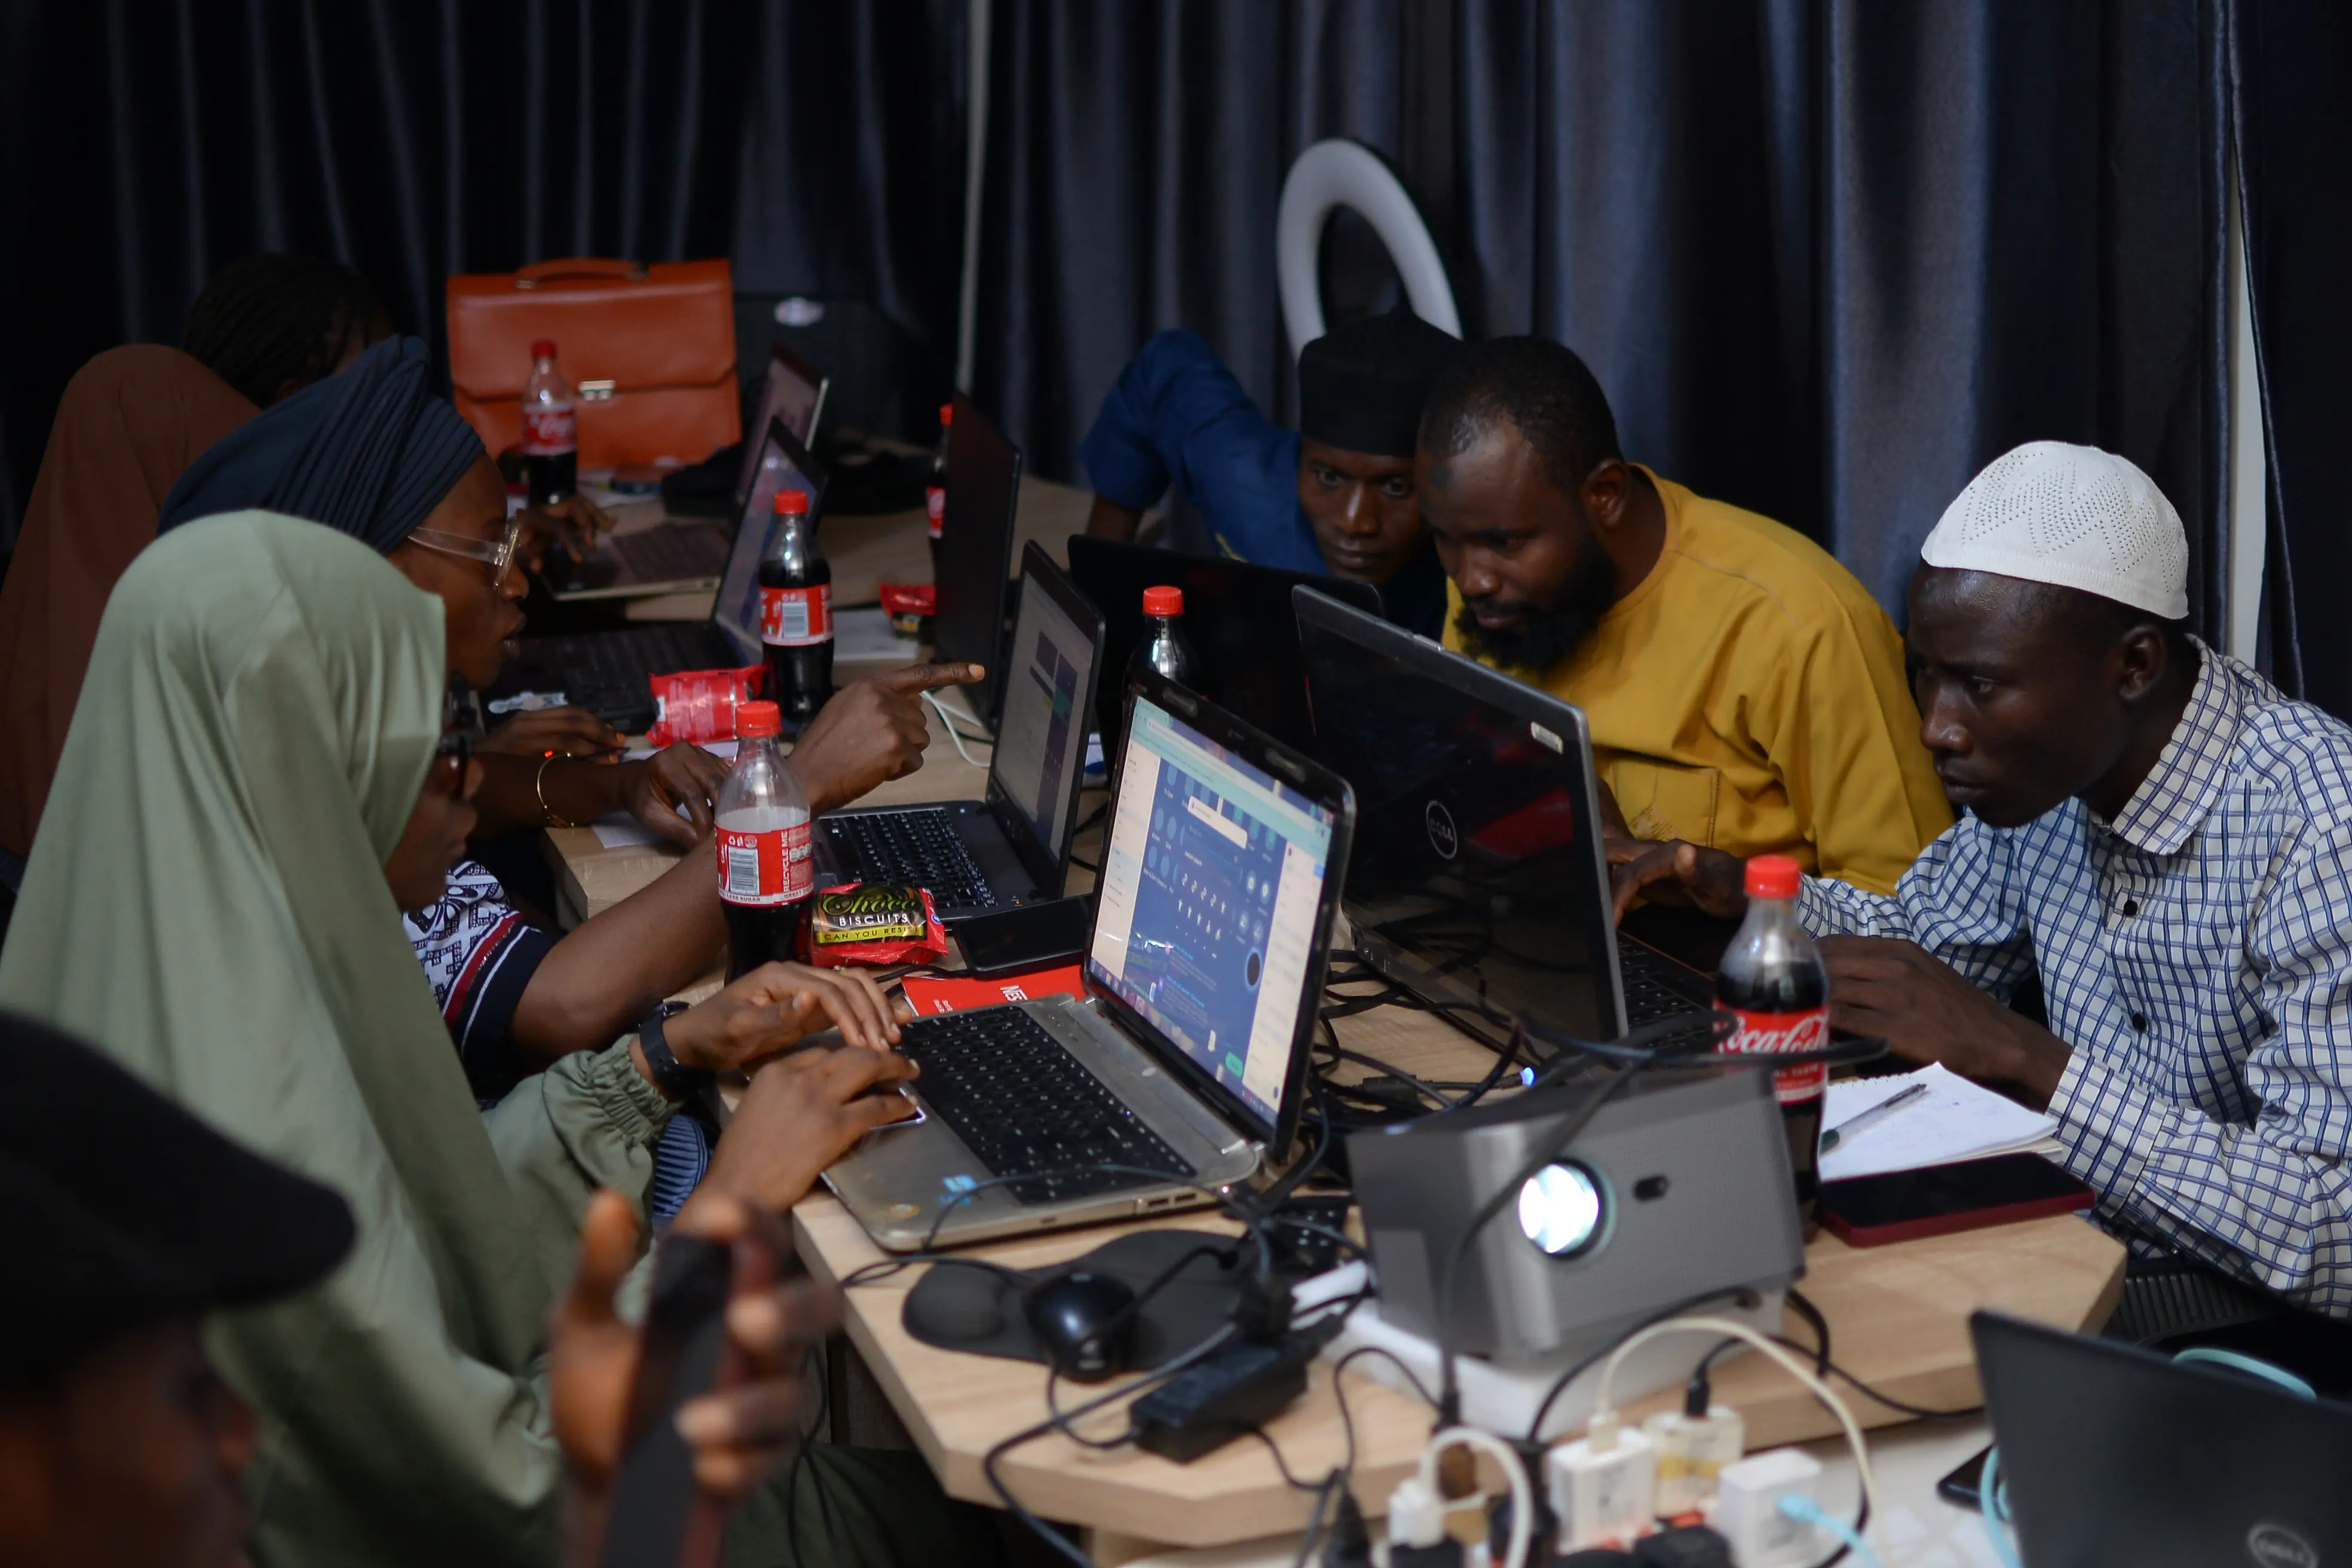
For a student in Ilorin balancing lectures, SIWES, or other responsibilities, the right choice may depend on transport, timetable, laptop access, and the level of support required.
Before selecting a training provider, ask how assignments are delivered, how questions are answered, and what happens when you fall behind.
What Does It Cost to Learn Data Science in Nigeria?
There is no single price for learning data science.
You can begin with free educational materials and public datasets. A structured training programme may charge tuition for instruction, assessments, project supervision, facilities, and other learning support.
Your total cost also depends on equipment, connectivity, and the time required to practise.
If you are exploring the field for the first time, free introductory lessons can help you decide whether you enjoy the subject before making a larger financial commitment.
Free resources worth exploring
A useful starting point for understanding business intelligence, visualisation, and reporting.
Interactive lessons for practising introductory SQL queries.
A detailed reference for learning Python. Complete beginners may find it helpful to start with a simpler introduction before working through the tutorial.
Practical introductory learning materials covering Python, pandas, data visualisation, SQL, and machine learning, with opportunities to work on exercises.
Some learning platforms offer additional paid features or certifications, so check their current conditions.
Learning Data Science and Data Analytics in Ilorin
For learners who prefer a structured programme, it helps to compare the curriculum, delivery format, and expected project outcomes before enrolling.
Craft Innovation Hub (CIH), a technology and innovation training hub in Adeta, Ilorin, offers separate professional learning pathways in data analytics and data science.
Its published programmes illustrate two different approaches.
Data Analytics Professional
This is a 12-week, physical training programme focused on using data to support decisions.
The curriculum includes Excel, Google Sheets, SQL, introductory Python, Power BI, data cleaning, visualisation, and analytical reporting.
Participants work toward practical assignments and a capstone involving a dashboard, interpretation of findings, and a report.
Published tuition: ₦150,000.
Explore CIH’s Data Analytics Professional programme.
Data Science Professional
This is a six-month blended programme covering Python, data preparation, statistics, SQL, visualisation, machine learning, and project development.
Its curriculum also includes model evaluation, technical documentation, and communication.
Learners work toward a capstone addressing a real or realistic problem, using appropriate analytical and modelling techniques.
Published tuition: ₦350,000.
Explore CIH’s Data Science Professional programme.
Both programmes are designed to develop practical skills through assignments and project work. Their technical depth, duration, and delivery formats differ.
Course fees, cohort dates, and availability should be checked on the relevant programme pages before applying.
The important lesson applies to any training provider: choose a course because its learning outcomes suit your goals, not simply because its title sounds impressive.
Can You Get a Data-Related Job After Completing a Course?
A course can help you develop foundational or specialised skills, but completion alone does not guarantee employment.
Employers and clients may evaluate your ability to solve problems, work with tools, explain decisions, and deliver results.
Depending on your skills and experience, data-related career paths may include:
- Data analyst.
- Reporting analyst.
- Business intelligence analyst.
- Research analyst.
- Data scientist.
- Machine learning specialist.
- Analytics or operations professional.
Some roles are suitable for people developing foundational analytical skills. Others require deeper technical knowledge, experience, or formal qualifications.
It is also important to recognise that job titles vary between organisations.
A practical approach is to examine actual job descriptions, identify frequently requested skills, and compare them with what you are learning.
A useful portfolio project should demonstrate not just your final output but also your reasoning.
What question were you answering? Where did the data come from? How did you clean it? What limitations did you find? Why did you choose that analytical method?
Being able to answer those questions is an important part of developing professional competence.
Common Mistakes Beginners Should Avoid
Learning too many tools at once
You do not need Excel, Power BI, Tableau, Python, R, SQL, and several machine learning libraries on your first day.
Build one skill, practise it, and gradually expand.
Watching tutorials without practising
Understanding a demonstration is different from solving a problem yourself.
After each lesson, repeat the exercise without following every step of the tutorial.
Copying projects without understanding them
You can learn from examples, but you should be able to explain your own calculations, code, assumptions, and findings.
Ignoring data quality
Incorrect or incomplete information can produce misleading conclusions, even when the calculations are technically correct.
Mistaking correlation for causation
Two things changing together does not necessarily mean one caused the other.
This is especially important when making business, medical, or policy recommendations.
Focusing only on certificates
Certificates can be useful records of learning, but practical competence requires more than attendance.
Build projects you can explain, improve, and defend.
Expecting immediate employment
Developing technical skills takes time. So does building professional credibility.
Set realistic goals and measure your progress through the problems you can solve.
Frequently Asked Questions
Can I learn data science without knowing how to code?
Yes. You can begin a beginner-friendly programme without previous coding experience. However, most technical data science pathways require you to learn programming, commonly Python, as you progress.
Should I learn data analysis before data science?
For many beginners, data analysis is a useful foundation because it introduces data cleaning, statistics, interpretation, and visualisation. However, a structured data science programme can also teach these foundations from the beginning.
Is data science harder than data analysis?
Data science often involves a broader technical foundation, including programming, statistics, and machine learning. That may make some learning paths more demanding, but difficulty also depends on the specific course, project, and learner.
Do I need to be good at mathematics?
You need a willingness to learn relevant mathematical and statistical concepts. Introductory data analysis may begin with arithmetic, percentages, and descriptive statistics, while advanced data science can require deeper statistical and mathematical understanding.
Can I learn data analysis with only a smartphone?
A smartphone can help you read lessons and watch tutorials. However, a laptop or suitable computer is much more practical for spreadsheet work, SQL, programming, dashboards, and portfolio projects.
How long does it take to learn data science?
There is no universal timeline. Learning basic concepts may take weeks, while developing competence across programming, statistics, machine learning, and independent projects commonly requires sustained study and practice over a much longer period.
Are data science and artificial intelligence the same?
No. Data science focuses on extracting understanding and value from data using analytical, statistical, and computational methods. Artificial intelligence is a broader field concerned with systems that perform tasks associated with intelligent behaviour. The fields overlap, especially in machine learning.
Which is better for someone interested in business?
Data analytics may be a particularly useful starting point if your main goal is to understand sales, operations, customer behaviour, and business performance. Data science may become relevant when you need more advanced modelling or predictive methods.
Final Thoughts: Start With the Problem, Not the Job Title
You do not have to decide your entire career before learning your first data skill.
Start with a small problem.
Take a dataset. Organise it. Ask a question. Calculate something useful. Explain what you found.
If you enjoy investigating records, identifying patterns, and communicating findings, data analysis may be a natural starting point.
If you are also drawn to programming, statistics, experimentation, and predictive modelling, data science may be the direction you want to explore further.
Whichever path you choose, look for opportunities to practise, receive feedback, and build evidence of your progress.
The most meaningful question is not simply whether you have learned data science or data analysis. It is whether you can use what you have learned to understand a problem and develop a defensible solution.
If you are exploring structured training in Ilorin, you can compare the Data Analytics Professional and Data Science Professional pathways at Craft Innovation Hub.
Take your time, examine the curriculum, and choose the learning experience that fits where you are today and where you want to grow.
Craft Innovation Hub | Crafting Futures, One Innovation at a Time.