
A dataset may contain thousands of records, but that does not automatically make it useful.
Before patterns can be explored, charts can be built, or conclusions can be drawn, the data itself has to be properly prepared.
That was part of the practical challenge taken on by Idris Idris Ayobami, a Data Analysis learner at Craft Innovation Hub, in a learner project built around student performance data.
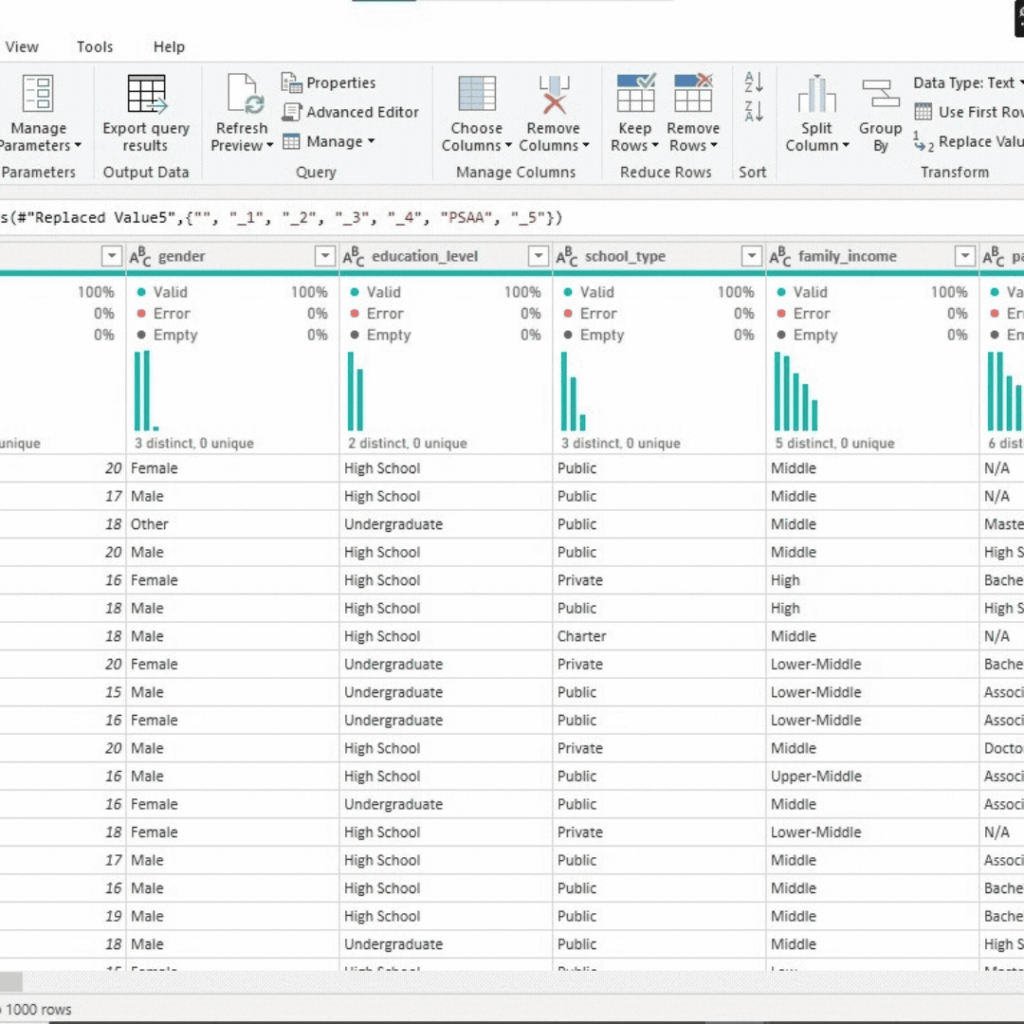
Using Microsoft Power BI, Idris worked with the supplied student examination performance dataset, with the project focusing on data cleaning and preparation.
The Project
The dataset used for the project contains information about students and different factors connected to their academic activities and examination performance.
Rather than jumping immediately into charts and conclusions, the project begins with a more fundamental question:
Is the data ready to be analysed?
Why Start With Data Cleaning?
Raw data is rarely something an analyst should simply import and immediately start visualising.
A dataset may contain inconsistent values, unnecessary fields, missing information, unsuitable data types or structural issues that can affect later analysis.
That makes cleaning and preparation an important part of the analytical process.
In this project, Idris used the Power BI environment to work with the student performance dataset and prepare it for further analysis.
The project demonstration shows the dataset being worked on within Power BI as part of this preparation process.
This stage matters because the quality of any later analysis depends heavily on the quality and structure of the data being analysed.
What Does an Analyst Look For?
Working with a dataset like this requires more than simply opening the file.
An analyst may need to examine questions such as:
- Are the column names properly structured?
- Are numerical values stored as the correct data type?
- Are there empty or unnecessary fields?
- Are categorical entries consistent?
- Are there missing values?
- Are there duplicates?
- Are there values that need to be corrected or standardised?
- Is the resulting dataset structured well enough for analysis and visualisation?
These checks help create a stronger foundation for whatever comes next.
Craft Innovation Hub’s current Data Analytics training similarly places data cleaning and preparation before deeper analysis, visualisation and dashboard development. CIH describes its training model as practical and project-based, with learners expected to work directly with datasets rather than only study concepts.
So, What Can the Student Data Tell Us?
Potentially, quite a lot.
The dataset contains variables relating to study behaviour, attendance, previous academic performance, examination preparation, wellbeing and final examination outcomes.
That creates room for further analysis of questions involving, for example:
- examination performance and attendance;
- study habits and scores;
- revision and practice;
- previous and current academic performance;
- motivation and examination preparation; or
- other relationships between variables contained in the dataset.
But there is an important distinction.
The presence of these variables in the dataset does not itself prove that one causes or even meaningfully influences another.
Those relationships would need to be properly analysed before any finding could be reported.
For this Learner Project, the evidence available supports documenting Idris’s work with the dataset in Power BI and the data-cleaning stage. It would therefore be inaccurate to attribute performance findings to him that have not been demonstrated in the project.
That distinction is itself part of responsible data analysis: do not make the data say more than the evidence supports.
From Raw Records to Analysis-Ready Data
The value of this project lies partly in what happens before the final dashboard.
Cleaning data may not always be the most visible part of an analytics project, but it is one of the stages that determines whether later calculations and visualisations can be trusted.
By working through the student performance dataset in Power BI, Idris is developing experience with a workflow that data analysts regularly encounter: taking raw information and preparing it for more meaningful analysis.
CIH’s Learner Projects platform is built around this hands-on philosophy, where learners develop skills through projects and practical exercises rather than classroom theory alone.
Watch the Project
Learner: Idris Idris Ayobami
Learning Area: Data Analysis
Project: Student Performance Data
Primary Tool: Microsoft Power BI
Project Focus: Data Cleaning and Preparation
The video provides a closer look at Idris working with the dataset within Power BI.
One Project, One Step in a Bigger Learning Journey
A complete analytical workflow can involve several stages: understanding the problem, preparing the data, analysing it, visualising results, interpreting findings and communicating what those findings mean.
Data cleaning is therefore not the end of the process.
It is the foundation on which the rest of the process depends.
At Craft Innovation Hub, learners in Data Analytics are expected to build practical experience across these stages and work towards portfolio evidence that demonstrates what they can do. CIH’s current programme describes practical datasets, cleaning, Power BI, dashboard development, interpretation and portfolio-ready project work as central parts of the learning pathway.
For Idris Idris Ayobami, this student performance project represents another practical step in that journey.
Not just learning what Power BI does, but applying it to real data and developing the discipline required to work with information carefully.
Because before data can answer a question, someone has to make sure the data itself is ready to be questioned.